


THE CLIMATE SCORECARD MAGAZINE
A way to learn about efforts to fight climate change
in leading greenhouse gas emission countries
Issue #17 // September 2026
Current Emission Levels
Climate Scorecard depends on donations from people like you
ABOUT CLIMATE SCORECARD MAGAZINE
Climate Scorecard Magazine is a monthly digital magazine intended to inform those interested in climate change about trends to reduce emissions in leading greenhouse emitting countries. Each month we will focus on a different topic related to climate change, e.g. fossil fuels, renewable energy; and provide our readers with information and analysis of policy and program trends within and across countries. We trust our magazine will help increase your knowledge and understanding and welcome your feedback. Please send any comments to: contact (at) climatescorecard.org.
Ron Israel
Publisher and Editor
Climate Scorecard Magazine
Introduction
Unfortunately, greenhouse gas emissions (GHG) in most countries have not been falling fast enough to sufficiently reduce global warming. Climate Scorecard Magazine #17 presents information on the emission levels in leading greenhouse gas emitting countries that reflects this trend. The information provided includes: each country’s current level of greenhouse gas emissions; and which sectors have the largest and smallest amounts (in terms of numbers and percentages) of the greenhouse gas emissions.
We also provide descriptions of the degree to which each country has been able to reduce (or increase) their GHG emissions from the emission level they presented when signing the Paris Agreement; the degree to which each country is on track to reduce its emissions by 50% (from 2020 levels) by 2030; and become carbon neutral by 2050. We also analyze the impediments each country has making greater reductions in greenhouse gas emissions. Table A below summarizes the data for each country. Complete Country Reports follow.
Table A: Summaries of Country Emission Levels
| Country | Emission Status Highlight |
| Australia | Australia’s climate challenge has become a coordination problem involving infrastructure, industry, government and communities—not merely a question of installing more generation capacity. |
| Brazil | Illegal deforestation in Brazilian biomes acts as a negative “wildcard,” capable of nullifying efficiency gains in any other area and distancing the country from its global climate responsibilities. |
| Canada | Canada is not on track to reduce its emissions by 50% from 2020 levels by 2030 or to become carbon neutral by 2050. |
| China | The most formidable bottleneck to deep decarbonization remains China’s structural reliance on coal to guarantee grid stability and industrial output. |
| European Union | The EU’s emissions in 2026 is 40% down from previous years, but the hardest cuts lie ahead. |
| France | France emitted around 366 million tonnes of CO₂ equivalent in 2024. This represents a decrease of about 1.8% compared with 2023, continuing the general reduction trend observed in France over the last decade. |
| Germany | The most recent official data, covering 2025, shows Germany still moving in the right direction overall, but at a pace that has slowed sharply and raises real questions about whether those targets are within reach. |
| India | India’s total greenhouse gas emissions are approximately 3.19 billion tons of CO2 per year—making it the third-largest global emitter. |
| Indonesia | Overall national emissions continue to increase because emissions from the energy sector have grown faster than reductions achieved in the land sector. |
| Japan | Japan continues to cut greenhouse gas emissions but major challenges remain. |
| Mexico | Mexico’s current mitigation plans slow the growth curve, but they are not yet aggressive enough to reverse it completely. |
| Nigeria | The single biggest obstacle to deeper cuts is structural: Nigeria’s economy runs on oil and gas. |
| Saudi Arabia | Saudi Arabia’s emissions are projected to rise to 819–845 MtCO2e in 2030, a 13–17% increase from 2019 levels, giving it one of the world’s highest per capita emission levels. |
| South Africa | The greatest impediment to reducing emissions is coal, understood not simply as a fuel but as an entire economic and political system. The largest source is clear, the tools exist, and the remaining gap is implementation at a pace the country has not yet found. |
| Turkey | Türkiye’s emissions continue to increase, reflecting the challenges of balancing rapid economic development with climate mitigation. |
| United Kingdom | Britain’s emissions continue to fall, but the hardest climate challenges Still lie ahead. |
| United States | The Republican Party in this administration does not prioritize climate reduction or climate-friendly policies, and instead, prioritizes emissions contributors that continue to worsen the climate crisis. |
Country Reports
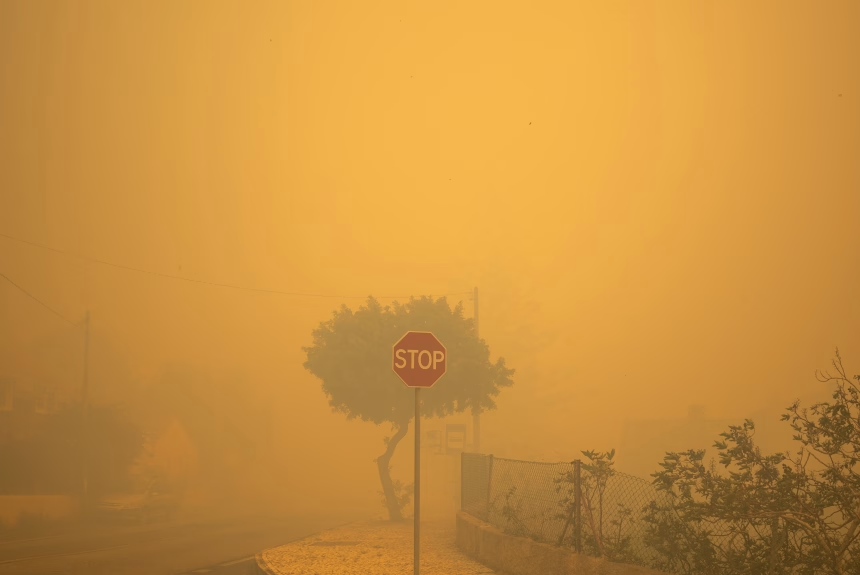
Australia: Current Emission Levels
Australia’s climate challenge has become a coordination problem involving infrastructure, industry, government and communities—not merely a question of installing more generation capacity.Australia’s greenhouse gas emissions are falling, but the decline is not yet fast or broad enough to demonstrate a secure pathway to its climate targets. The latest complete annual inventory records net national emissions…

Brazil: Current Emission Levels
Illegal deforestation in Brazilian biomes serves as a negative “wildcard,” capable of nullifying efficiency gains in other areas and distancing the country from its global climate responsibilities.In 2024, Brazil recorded a total greenhouse gas (GHG) emissions volume of 2,145,225,627 tons of CO2 equivalent (tCO2e). Data from the SEEG (System for Estimating Greenhouse Gas Emissions and…
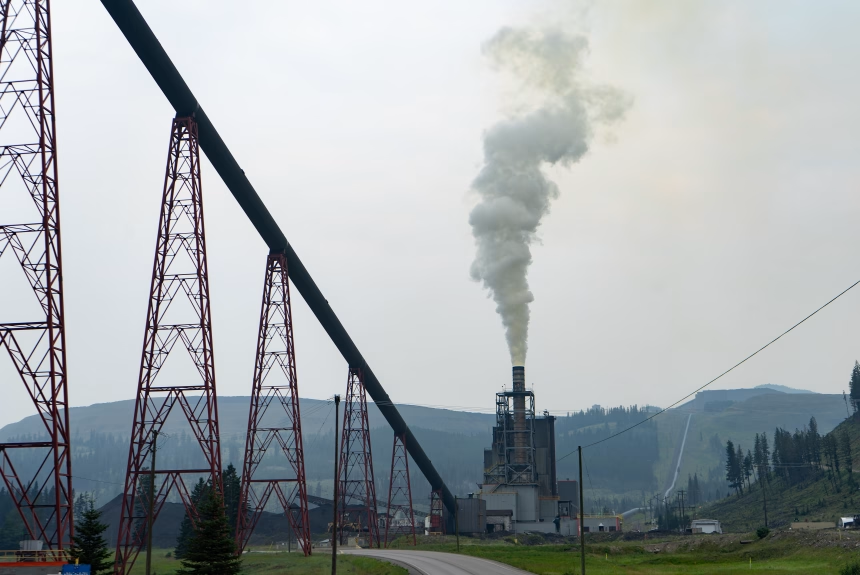
Canada: Current Emission Levels
Canada is not on track to reduce its emissions by 50% from 2020 levels by 2030 or to become carbon neutral by 2050. Canada ratified the Paris Agreement on October 5, 2016. National inventories of greenhouse gases (GHGs) are submitted to the UNFCCC annually by April 15 of each year. The following data are taken…
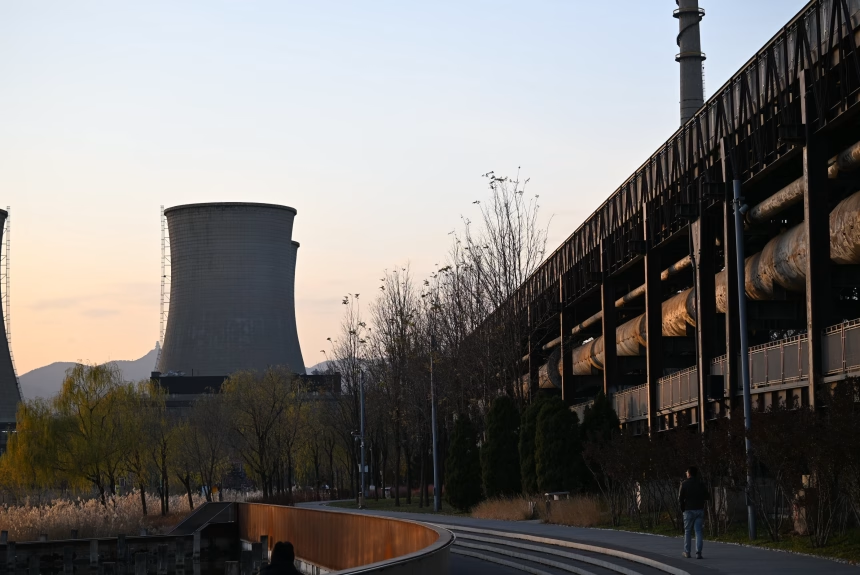
China: Current Emission Levels
The most formidable bottleneck to deep decarbonization remains China’s structural reliance on coal to guarantee grid stability and industrial output. China’s total greenhouse gas (GHG) emissions reached an estimated 15.54 billion metric tons of CO₂ equivalent (CO₂e) in 2024. However, recent macroeconomic and structural analyses indicate that absolute emissions plateaued at approximately 14.8 gigatonnes of…
EU: Current Emission Levels
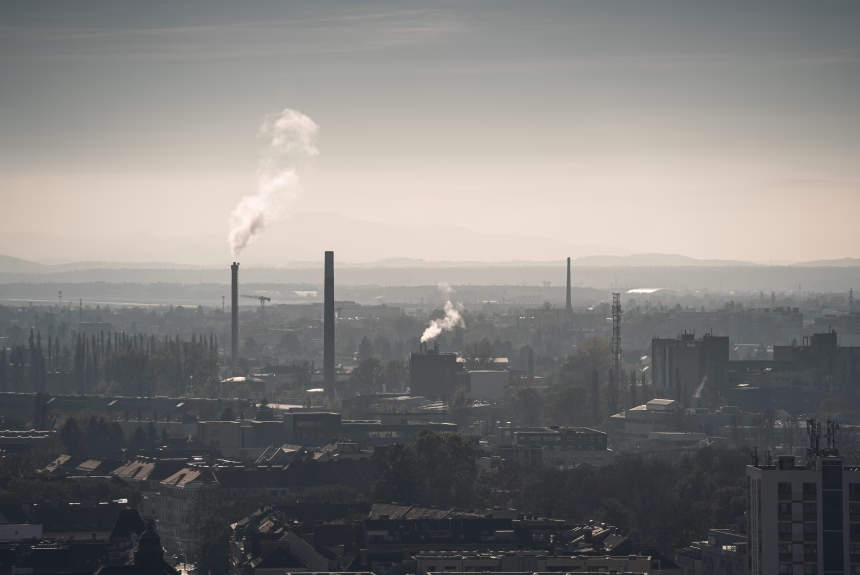
The EU’s Emissions in 2026: 40% Down, but the Hardest Cuts Lie Ahead The European Union has just crossed a symbolic milestone. According to official data submitted to the United Nations Framework Convention on Climate Change (UNFCCC) and analysed by the European Environment Agency (EEA), the bloc has now cut its greenhouse gas (GHG) emissions…

France: Current Emission Levels
France emitted around 366 million tonnes of CO₂ equivalent in 2024. This represents a decrease of about 1.8% compared with 2023, continuing the general reduction trend observed in France over the last decade.According to Citepa, the organization responsible for France’s official greenhouse gas inventory, France emitted around 366 million tonnes of CO₂ equivalent in 2024….

Germany: Current Emission Levels
The most recent official data, covering 2025, show the country is still moving in the right direction overall, but at a pace that has slowed sharply, raising real questions about whether those targets are within reach. Germany is Europe’s largest economy and, historically, one of the continent’s biggest emitters, so how it manages its own…
India: Current Emission Levels
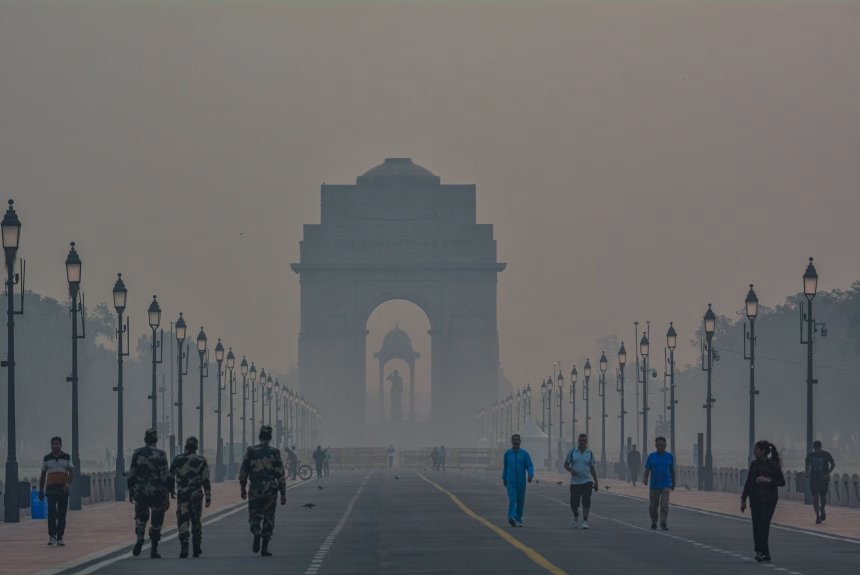
India’s total greenhouse gas emissions are approximately 3.19 billion tons of CO2 per year — making it the third-largest global emitter. According to Ritchie and Rosado (2025), India’s total greenhouse gas emissions are 3.19 billion tons of CO₂ annually, accounting for approximately 8.27% of global CO₂ emissions. The global emission total is 53.2 gigatons (Gt), with…
Indonesia: Current Emission Levels
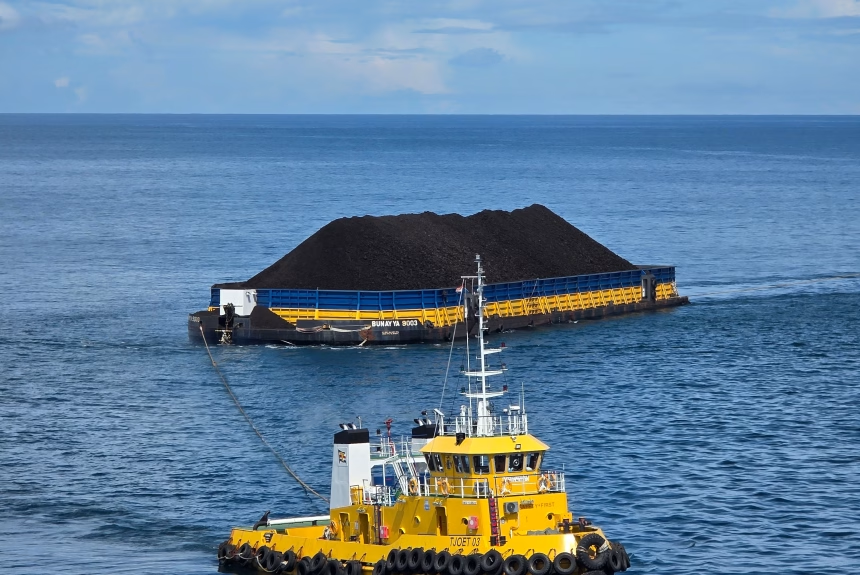
Overall national emissions continue to increase because energy sector emissions have grown faster than reductions in the land sector.Indonesia is the sixth-largest greenhouse gas emitter globally in terms of total emissions, reflecting its large population, extensive land-use change, peatland degradation, and fossil fuel use. However, on a per capita basis, Indonesians emit substantially less greenhouse…

Japan: Current Emission Levels
Japan Continues to Cut Greenhouse Gas Emissions, but Major Challenges RemainFor the first time since greenhouse gas inventories were introduced in 1990, Japan’s annual emissions have fallen below one billion tonnes of carbon dioxide equivalent (CO₂e), marking a significant milestone in the country’s climate transition. It is a major political milestone for Tokyo, capping off…

Mexico: Current Emission Levels
Mexico’s current mitigation plans slow the growth curve, but they are not yet aggressive enough to reverse it completely.We are seven months into the year 2026. Back in January, I reported on Mexico’s ambitious climate plans for the republic. They were bold and strategic, but did they make a dent? Let’s look at where we…
Nigeria: Current Emission Levels
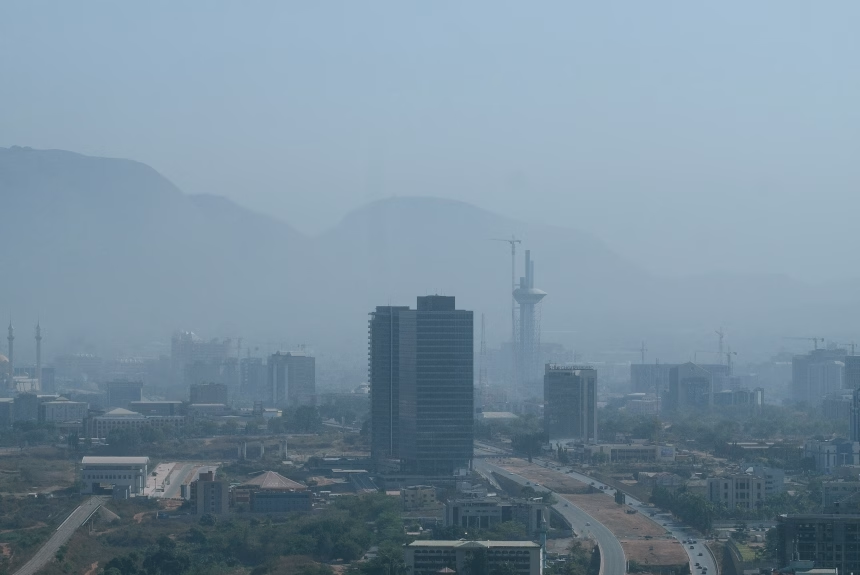
The single biggest obstacle to deeper cuts is structural: Nigeria’s economy runs on oil and gas. In 2022, Nigeria emitted 554.1 million tonnes of greenhouse gases into the atmosphere, and the figure has been climbing for years. In 2020, it was 520.4 million tonnes. In 2021, it rose to 532.6 million tonnes. By 2022, it…

Saudi Arabia: Current Emission Levels
Saudi Arabia’s emissions are projected to rise to 819–845 MtCO2e in 2030, a 13–17% increase from 2019 levels, giving it one of the world’s highest per capita emission levels, Saudi Arabia’s current total greenhouse gas (GHG) emissions are 838,876,551 MtCO2e. Saudi emissions increased by 2.5%, or 20,684,825 MtCO2e over 2023, when GHG emissions were 818,191,726 MtCO2e. This accounts for 1.6%…
South Africa: Current Emission Levels
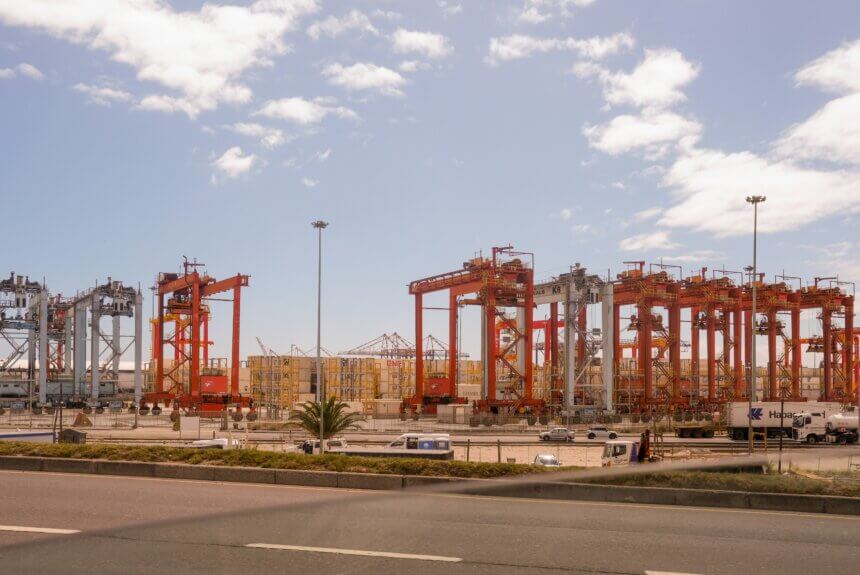
The greatest impediment is coal, understood not simply as a fuel but as an entire economic and political system. The largest source is clear, the tools exist, and the remaining gap is implementation at a pace the country has not yet found.South Africa’s emissions story is a stubborn plateau. Private solar is spreading, climate legislation…

Turkey: Current Emission Levels
Türkiye’s emissions continue to increase, reflecting the challenges of balancing rapid economic development with climate mitigation.As countries around the world strive to align their climate policies with the goals of the Paris Agreement, Türkiye presents a complex picture. The country has made notable progress in expanding renewable energy, improving energy efficiency, and developing a national…
UK: Current Emission Levels
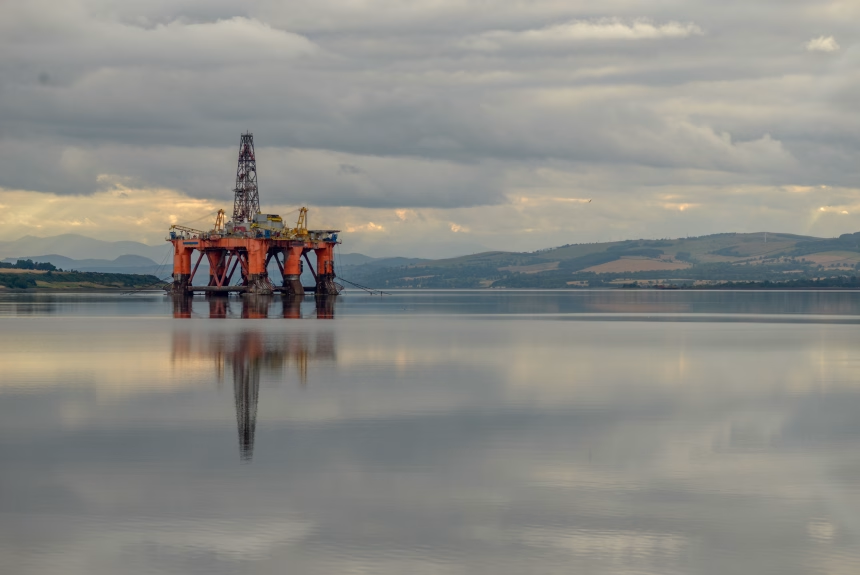
Britain’s Emissions Continue to Fall, but the Hardest Climate Challenges Still Lie Ahead The United Kingdom remains one of the world’s leading examples of long-term greenhouse gas emission reductions. Recent government statistics indicate territorial greenhouse gas emissions of approximately 385 MtCO₂e, excluding international aviation and shipping. These figures, published by the Department for Energy Security…
US: Current Emission Levels
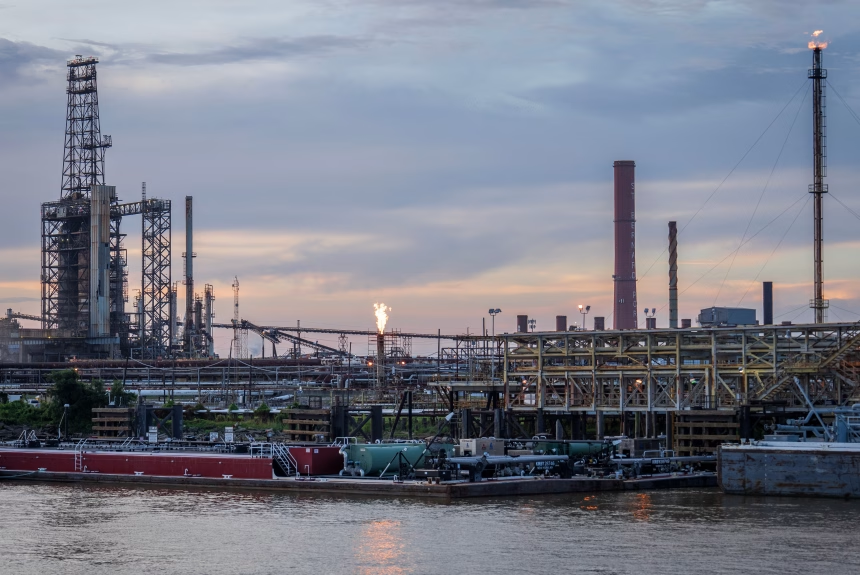
The Republican Party in this administration does not prioritize climate reduction or climate-friendly policies and instead prioritizes emissions contributors that continue to worsen the climate crisis.The United States’ most recent data on greenhouse gas (GHG) emissions for 2025 show that the US emitted 5.35 billion metric tons of CO2 equivalent, an increase of 2.4% from…
Climate Commitments
Tracking the short and long-term climate goals of leading greenhouse emissions countries
Read More

NDC Tracking Sources
View the sources we use to track progress of countries’ committments.
Read More