

The greatest impediment is coal, understood not simply as a fuel but as an entire economic and political system. The largest source is clear, the tools exist, and the remaining gap is implementation at a pace the country has not yet found.
South Africa’s emissions story is a stubborn plateau. Private solar is spreading, climate legislation is now in force, and the national pledge has been updated. Still, the country’s greenhouse gas profile reflects an economy built around coal power, energy-intensive industry, and liquid-fuels production, and that makes actual progress slow and difficult to maintain.
This post uses the 2025 release of EDGAR, the European Commission’s Emissions Database for Global Atmospheric Research, which provides GHG time series for all countries from 1970 through 2024. EDGAR puts South Africa’s total GHG emissions at 569.81 MtCO2e in 2024, excluding land use, land-use change and forestry (LULUCF). That is 1.07% of global emissions. Official UNFCCC inventory reporting typically lags by several years; the most recent national inventory covers only up to 2022. The EDGAR 2025 dataset therefore provides the most current comparable picture available, even though it uses a different methodology from South Africa’s official accounting.
Table 1: South Africa’s GHG emissions by source category, 2024 (excl. LULUCF)
| Emissions source category | Emissions (MtCO2e) | Share of total |
|---|---|---|
| Power generation | 233.5 | 41.0% |
| Fuel exploitation, production, refining | 111.2 | 19.5% |
| Industrial combustion and processes | 88.9 | 15.6% |
| Transport | 45.3 | 8.0% |
| Agriculture | 40.1 | 7.0% |
| Waste | 26.3 | 4.6% |
| Buildings | 24.4 | 4.3% |
Source: EDGAR 2025 GHG Database, European Commission Joint Research Centre, September 2025.
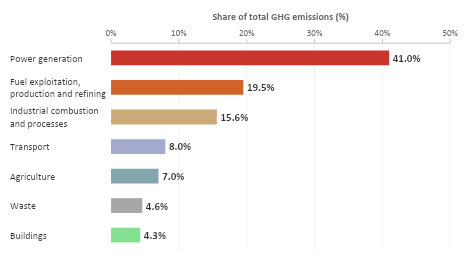
Figure 1: Share of total GHG emissions by source category, South Africa, 2024—source: EDGAR 2025.
Power generation accounts for 41% of South Africa’s total emissions; the largest single source by a wide margin, and the clearest argument for why the energy transition is central to any credible mitigation plan. Fuel exploitation, production, and refining account for nearly a fifth, reflecting South Africa’s coal-to-liquids operations and petroleum refining. Sasol’s Secunda plant alone is one of the world’s largest single-point emitters of CO2. Industrial combustion and processes contribute a further 15.6%. Together, these three categories account for more than three-quarters of the national total.
The smallest shares are buildings at 4.3% and waste at 4.6%. Landfill gas capture, stricter building standards, and waste reduction can further reduce these. They will not move the national curve on their own. Agriculture at 7% is driven mainly by livestock: methane from enteric fermentation in cattle and sheep accounts for the bulk of that sector’s output, with agricultural soils and manure management making up most of the rest. It is also the only major category in which emissions have declined since 2000, as livestock populations have fallen.
When South Africa signed the Paris Agreement in 2016, EDGAR estimates emissions stood at around 585 MtCO2e. By 2024, they had edged down to 569.81 MtCO2e, a fall of roughly 2.6% over nine years. The 2023 EDGAR figure was 555 MtCO2e, so 2024 actually showed a slight rise. The decline from the Paris baseline is real but fragile; not the kind of sustained downward trend the Agreement demands.
South Africa’s updated 2021 NDC set a 2030 target range of 350 to 420 MtCO2e including LULUCF. A direct comparison with EDGAR figures requires caution because EDGAR excludes LULUCF while the NDC includes land-sector removals. Still, the direction is clear: current emissions remain well above the upper end of the 2030 target range on any accounting basis. In October 2025, South Africa submitted a new NDC with a 2035 target of 320 to 380 MtCO2e, confirming the net zero by 2050 direction but leaving the delivery mechanism thin.
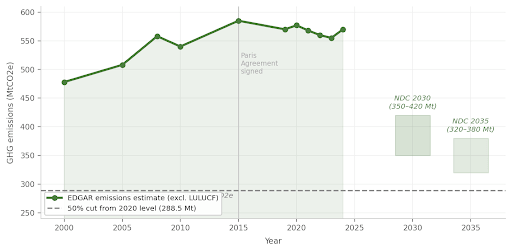
Figure 2: South Africa GHG emissions trajectory, 2000-2024 (EDGAR estimates, excl. LULUCF), with NDC 2030 and 2035 target ranges and 50% reduction benchmark from 2020 level. Note: NDC target ranges use national accounting that includes LULUCF; comparison is directional. Sources: EDGAR 2025; NDC Partnership, 2025; Climate Action Tracker, 2025.
On track to cut emissions by 50% from 2020 levels by 2030? No. EDGAR puts 2020 emissions at 577 MtCO2e. Half of that is 288.5 MtCO2e. The country’s own 2030 NDC ceiling is 420 MtCO2e, which would represent less than a 30% reduction even on the most favourable reading. The Climate Action Tracker rates South Africa’s current policies as insufficient to meet even that target, let alone a 50% cut.
On track for net zero by 2050? South Africa has stated the intention in its Low-Emission Development Strategy and restated it in the 2025 NDC. The Climate Action Tracker does not formally evaluate the net zero target, citing incomplete information. With coal still supplying over 80% of electricity and the energy transition dependent on grid investment that is years behind schedule, reaching net zero in 25 years would require a pace of change the country has yet to demonstrate.
The greatest impediment is coal, understood not simply as a fuel but as an entire economic and political system. Eskom’s aging coal fleet still carries most of the load. Transmission constraints slow the renewable build-out. Mpumalanga’s coal towns depend on mines, power stations and municipal revenues, which means a faster transition must also be a credible jobs and investment plan, not just a plant retirement schedule. The carbon tax has been operational since 2019, but generous exemptions keep the effective rate well below what is needed to shift investment decisions. The legislation exists, the renewable resources are there, and private capital is available. What is missing is speed.
Emissions have probably peaked, but the 2024 uptick is a reminder that a plateau is not a decline. The largest source is clear, the tools exist, and the remaining gap is implementation at a pace the country has not yet found.
This Post was submitted by Climate Scorecard South Africa Country Manager Jone Carter.
Learn More Resources
- EDGAR 2025 GHG Database. European Commission Joint Research Centre, September 2025.
- Climate Action Tracker. South Africa: Targets, Policies and Net Zero, updated May 2025.
- NDC Partnership. South Africa NDC, updated October 2025.
- DFFE. National GHG Inventory Report of South Africa 2000-2022, November 2024.