

Introduction
Climate Scorecard’s Report 57 seeks to identify one or more proxy measures for greenhouse gas emissions in leading greenhouse gas emitting countries. It builds on previous work that we have done on this topic that you can find in Report 49 and Report 53 for the countries we follow.
We asked our Country Managers to select ONE proxy measure from the measures they previously proposed and provide more information about the importance of the measure.
The proxy measures put forward provide consistent information on either a monthly, quarterly, or semi-annual basis (annual measurements are excluded). Examples include trends in sales and production of electric vehicles, air quality index trends, production of alternative energy, and others.
In the following Country Reports our Country Managers describe their proposed proxy measure, analyze its value as a measure that reflects trends in emissions in their country, describe the information source that provides data on their proxy measure, and present data trends for their proxy measure from the last 3 years.
They also provide a comparison of the data trends for their proposed proxy measure with the emission data trends for their country.
The Table below summarizes the proposed proxy measures for each of our countries. Complete Country Reports follow the Table. Also included is a spreadsheet where you can find all of the proxy measures proposed in Post 57 for Climate Scorecard countries.
Table: PROPOSED GREENHOUSE GAS EMISSION PROXY MEASURES
| Country | Proxy Measure |
| Australia |
|
| Brazil |
|
| Canada |
|
| China |
|
| European Union |
|
| France |
|
| Mexico |
|
| Nigeria |
|
| Saudi Arabia |
|
| South Africa |
|
| Spain |
|
| Turkey |
|
| United Kingdom |
|
| United States |
|
Country Reports
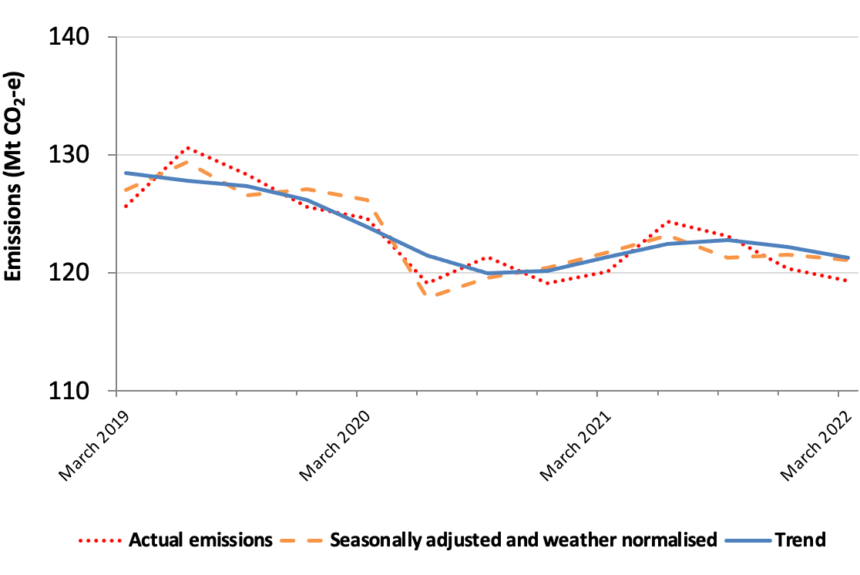
Australia’s Greenhouse Gas Emissions Reporting
Robyn Gulliver Australia’s primary database for tracking greenhouse gas emissions is the Greenhouse Gas Inventory (GGI), managed by the Australian Government Department of Industry, Science, Energy, and Resources (now renamed as Department of Climate Change, Energy, the Environment and Water (DCCEEW)). The data is released on a quarterly basis and provides the most up-to-date information…
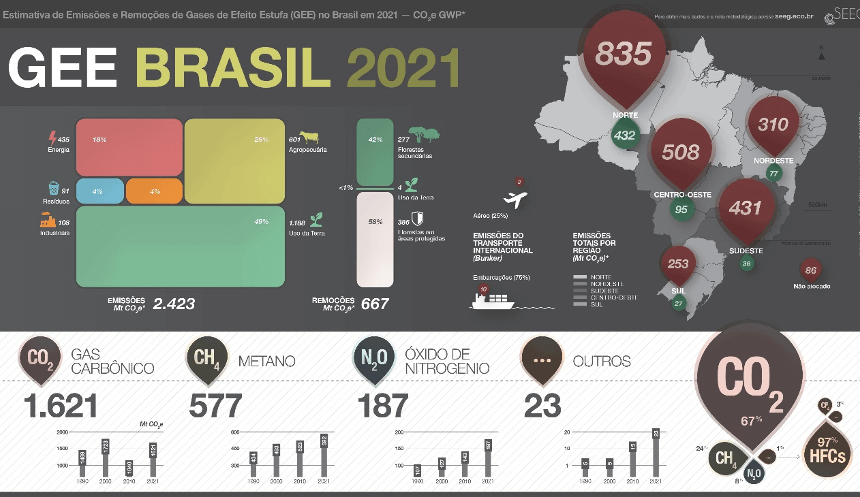
Brazil’s Greenhouse Gas Emissions Estimation System (SEEG)
Carlos Alexandre de Oliveira The Climate Observatory, a network that brings together 77 civil society organizations dedicated to discussing climate change in Brazil, released updated information on greenhouse gas emissions on 11/01/22. The data are part of the 10th edition of the Greenhouse Gas Emissions Estimation System (SEEG) and were published five days before COP27,…

Canada’s Climate Progress Indicators
Diane Szoller Our goal recently has been to visit indicators influencing climate change and their reporting processes over a 9-month period and a 3-year period for trends and any progress.Statistics Canada is responsible to Parliament through the Ministry of Innovation, Science and Industry. This open data, released under the Statistics Canada Open License is derived…

China’s Changing Mix of Electricity-Generating Sources Drives a Steady Decrease in Carbon Intensity
Annette Wiedenbach Electrification of China’s transport system, industry, heating, and other sectors is the backbone of the country’s drive to decarbonize its development. Therefore, it is important to take a look at the development of the sources of electricity: thermal combustion for power and the simultaneous growth of output and use of renewable energy sources…

EU’s Air Emissions Due to Economic Activity
Brittany Demogenes The proxy measure I have decided to use is air emissions from greenhouse gases due to economic activity in the EU. This information is updated quarterly. Economic activity is defined as the total greenhouse gas emissions that are produced in the EU due to agriculture, forestry, and fishing; mining and quarrying; manufacturing; electricity,…

France’s Proxy Measures for Greenhouse Gas Emissions
Liana Mehring In 2021, quarterly greenhouse gas emissions within the European Union and its member states became available for the first time with estimates published from 2010 through 2022. These quarterly greenhouse gas emissions are compiled and published by Eurostat, the statistical office of the European Union whose mission is to provide high-quality statistics and…

The Monitoring of Energy Change in Mexico
Pablo David Necoechea Porras “Energy is a central element of development and enables investments, innovations, and the emergence of new industries that are the engine of job generation, inclusive growth and shared prosperity of entire economies,” -Bank of Mexico. In Mexico, energy is an issue that isn’t related only to technology but also to social…
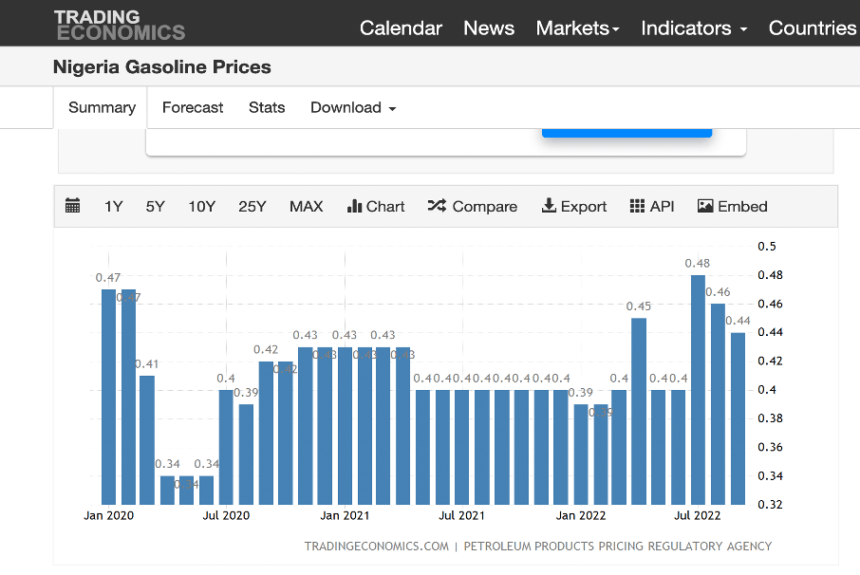
Nigeria: Oil and Gas Prices
Toyin Oladapo Global oil and gas prices are generally influenced by different factors like uncertain supply, temporary spikes and declines in demand, varying infrastructure investment levels, and political unrest in major oil-producing nations. Sustained skyrocketing oil and gas prices have implications for climate change and the environment. Increased oil and gas prices spur the development…
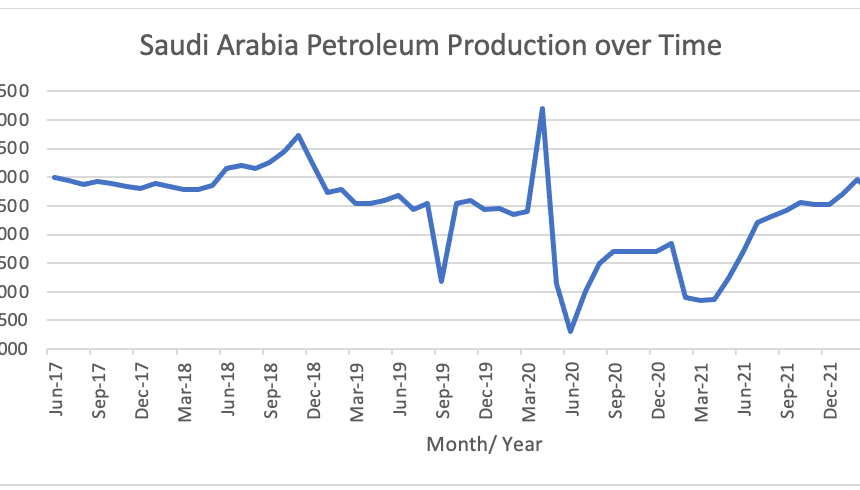
Saudi Arabia’s Petroleum Production, as a Proxy for the Country’s Carbon Emissions
Abeer Abdulkareem, Amgad Ellaboudy Total petroleum generation measures the amount of all petroleum products that Saudi Arabia generates and consists of liquid fuels, including crude oil and lease condensate, tight oil, extra-heavy oil, and bitumen. Total petroleum generation is measured by barrels per day and is provided on a monthly basis. It is a direct…
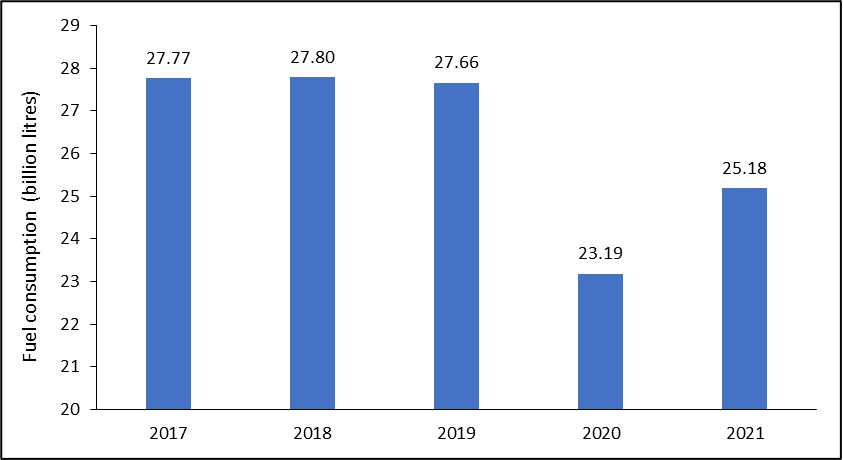
Fuel Consumption Data in South Africa
Deepti Charitar Department of Mineral Resources and Energy (DME) Quarterly Fuel Consumption Data South Africa is aiming to reduce its greenhouse gas emissions to 398 – 510 MtCO2e by 2025, and to 350 – 420 MtCO2e by 2030, under its latest Paris Agreement Pledge.Various proxy indicators can be used to monitor trends in greenhouse gas…

Spain’s Renewable Energy Generation and Consumption
Sean Lewis Data Provided on Renewable Energy Generation and Consumption by Red Electrica Following the European Green Deal, which has set binding targets for EU member states to reach by 2030, Spain has drawn considerable attention with its ambitiously laid out National Energy and Climate Plan (NECP) 2021-2030, committing to overachieve an expected 32% share…

Turkey’s Proxy Measures for Greenhouse Gas Emissions
Semih Ergur Prosperity, specifically in developed countries, due to the global industry has inevitably caused energy crises and environmental pollution. These issues demand close attention to be resolved sooner than later. The amount of energy produced and consumed is an important parameter affecting the level of emission as well as the source of the energy,…
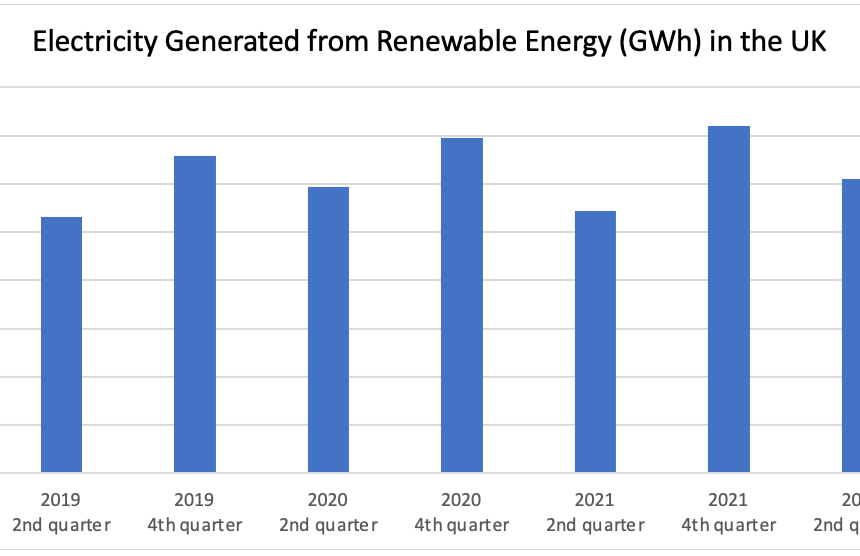
Renewable Energy Electricity Generation in the UK
Prastuti Saikia One of the most important measures or indicators in achieving carbon neutrality or net zero is the measurement of changes in renewable electricity generation. Renewable energy is energy that comes from a source that will not run out. They are natural and self-replenishing and usually have a low- or zero-carbon footprint. With the…
US Utility Scale Electricity Generation
Ron Israel In the first six months of 2022, 24% of U.S. utility-scale electricity generation came from renewable sources, based on data from our Electric Power Monthly. The renewables’ share increased from 21% for the same time period last year. Renewables are the fastest-growing electricity generation source in the United States.In 2020, U.S. greenhouse gas emissions…