

The gap isn’t in the legislation but in local government capacity, adaptation funding, and execution speed.
South Africa has warmed approximately 1.3°C since 1976, at roughly twice the global average rate, and the effects are visible in the data.
Since 2004, the national mean temperature has risen by an estimated 0.8°C above already-elevated baselines, with warming in the interior and western parts of the country reaching 2°C per century or higher. The Western Cape has seen a measurable decline in winter rainfall over the past two decades, consistent with a southward shift of the winter rainfall belt. Eastern parts of the country have experienced more variable rainfall, with longer dry spells interrupted by high-intensity events. ENSO cycles, particularly El Niño, continue to drive interannual variability, but the underlying warming trend is steadily raising baseline conditions.
The 2015 to 2018 drought across the Western Cape was the worst in over a century. Cape Town came within weeks of Day Zero in 2018, the point at which municipal water supply would have been cut to essential services only. Dam levels fell to below 20% of capacity across the system. The drought was partly attributed to three consecutive failed wet seasons, combined with higher evaporation rates driven by elevated temperatures. Agriculture in the Western Cape lost billions of rands in output, particularly in the wine, fruit, and cereal sectors.
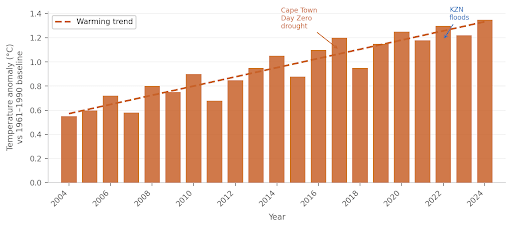
Figure 1: Annual temperature anomaly for South Africa, 2004-2024, relative to 1961-1990 baseline. Warming trend line shown in orange. Key climate events annotated. Sources: SAWS climate trends data; worlddata.info long-term station averages.
The opposite extreme has been equally damaging. South Africa has experienced more than 40 major flooding disasters over the past four decades, with frequency and intensity increasing. In April 2022, a cut-off low-pressure system dropped 200 to 400 mm of rain across KwaZulu-Natal in 24 hours, killing 436 people, destroying more than 12,000 homes and displacing around 40,000. Infrastructure damage exceeded R17 billion. A World Weather Attribution analysis found that climate change doubled the likelihood of the event, from once every 40 years to once every 20. The same province was hit again in December 2023, and the Western Cape suffered severe flooding in September 2023 with R1.4 billion in agricultural losses alone.
Wildfires are another accelerating threat. The 2017 Knysna fires in the Southern Cape killed seven people and destroyed more than 1,000 structures. The 2024 fire season was the deadliest on record nationally, with 34 lives lost, more than 4 million hectares burned, and 2,750 firefighting teams deployed. KwaZulu-Natal fires in July 2024 killed six firefighters and 1,600 livestock animals and burned 14,000 hectares. CapeNature and WWF South Africa have both noted that the wet-dry oscillation created by successive flood and drought cycles is generating unusually dense vegetation that then becomes fuel during dry summer seasons.
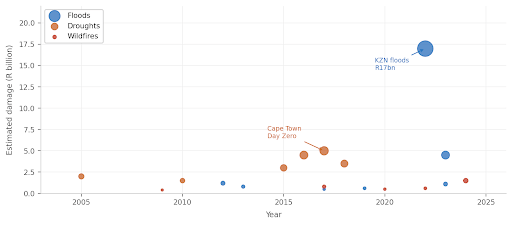
Figure 2: Selected major climate-related disasters in South Africa, 2004-2024, by event type and approximate damage cost (R billion). Bubble size is proportional to damage. Sources: ISS Africa; PreventionWeb; Working on Fire; SAWS; Wikipedia event records.
The projections are sobering. CSIR downscaling studies, using the 1971-2000 baseline, project average warming of 1 to 3°C across South Africa by 2050, rising to 4°C or more in the interior under higher-emissions scenarios. Western Cape winter rainfall is projected to decline by a further 10 to 30%. The frequency of high fire-danger days is projected to increase across the southwestern Cape and the northeastern interior. Sea levels along the coast are expected to rise by 0.2 to 0.5 meters by 2100 under moderate warming.
Table 1: Summary of projected climate changes for South Africa, 2021-2050
| Variable | Projected change (2021–2050) | Key risks |
|---|---|---|
| Temperature | +1 to +3°C by 2050 (interior up to +4°C) | Heatwaves, crop stress, dam evaporation, energy demand |
| Rainfall | Western Cape: -10 to -30%; eastern/interior: more variable | Water scarcity in west; flooding risk in east |
| Droughts | Longer, more intense; return periods shortening | Agricultural losses, municipal water crises |
| Floods | Higher-intensity events; cut-off lows more extreme | Infrastructure damage, displacement, disease |
| Wildfires | Extended fire season; more high-danger days in SW Cape and NE | Biodiversity loss, livestock, property, air quality |
| Sea level | +0.2 to +0.5m by 2100 (IPCC moderate scenario) | Coastal erosion, storm surge, infrastructure |
Sources: NCCIS Climate Projections (CSIR); IPCC AR6 Africa chapter; South African National Climate Change Adaptation Strategy, 2020.
The relationship between extreme weather and emission levels runs in both directions. Higher temperatures increase electricity demand for cooling, pushing more load through a grid that still relies on coal for over 80% of generation. Prolonged drought reduces hydropower output, placing additional pressure on thermal generation. The 2015-2018 Cape drought increased municipal pumping costs and the energy-intensive desalination and water-augmentation measures Cape Town was forced to deploy. Conversely, destructive floods disrupt renewable energy infrastructure and supply chains, slowing the transition.
Fire emissions are a growing but often overlooked contributor. Large wildfires release significant volumes of CO2, black carbon and methane. The 2024 fire season burned more than 4 million hectares and released emissions that South Africa’s official GHG inventory does not capture with the precision they deserve, particularly in vegetation-rich biomes like fynbos, among the most biodiverse and carbon-dense ecosystems on earth.
South Africa’s formal response framework rests on the National Climate Change Response Policy (2011), the National Climate Change Adaptation Strategy (2020), and the Climate Change Act (2024), which for the first time provides a legislative basis for binding adaptation and mitigation obligations. The Climate Change Act requires sectoral emissions targets, mandatory reporting, and sectoral adaptation plans across agriculture, water, health, biodiversity, and human settlements.
In practice, the most concrete adaptation investments have been in water. Cape Town’s response to Day Zero transformed municipal water management: consumption was cut by more than 50% through a combination of tariff restructuring, pressure management, and public behavior change. The city has since invested in groundwater abstraction, water recycling and aquifer recharge as long-term supply buffers. The Lesotho Highlands Water Project Phase 2, under construction, will add additional transfer capacity to the Vaal system by 2027.
On disaster risk, the South African Weather Service has expanded its early warning capacity, including a shift toward impact-based forecasting that communicates risk to communities in practical terms rather than meteorological abstractions. The Working on Fire program deploys aerial and ground firefighting resources nationally. However, the 2024 season exposed the limits of even a well-resourced program when fire conditions become extreme across multiple regions simultaneously.
The honest assessment is that the policy architecture is more developed than the implementation. The Climate Change Act took 13 years to develop and was only enacted in 2024. Adaptation plans are being developed, but funding gaps remain significant, and local government, which manages most frontline services, lacks the technical and financial capacity to act on national strategies. Multiple studies found that agricultural extension services, which are supposed to support smallholder farmers in adapting to shifting rainfall, have extremely low awareness of the National Climate Change Response Policy among their own staff.
The Climate Change Act, passed in 2024 after 13 years in development, finally gives adaptation and mitigation obligations legal force. The gap is not in the legislation but in local government capacity, adaptation funding, and execution speed. Plans that remain unimplemented offer no protection to the communities already absorbing the costs.
This Post was submitted by South Africa Climate Scorecard Country Manager, Jone Carter.
Learn More Resources
- NCCIS. Climate Trends and Climate Projections, National Climate Change Information System, DFFE.
- Fitchett et al. Trends and impacts of climate-induced extreme weather events in South Africa (1920-2023). Science of the Total Environment, February 2025.
- Carbon Brief. Climate change made extreme rains in 2022 South Africa floods twice as likely, May 2022.
- Working on Fire. 34 lives, 4 million hectares, billions of rands in damage: SA’s deadliest wildfire season, December 2024.